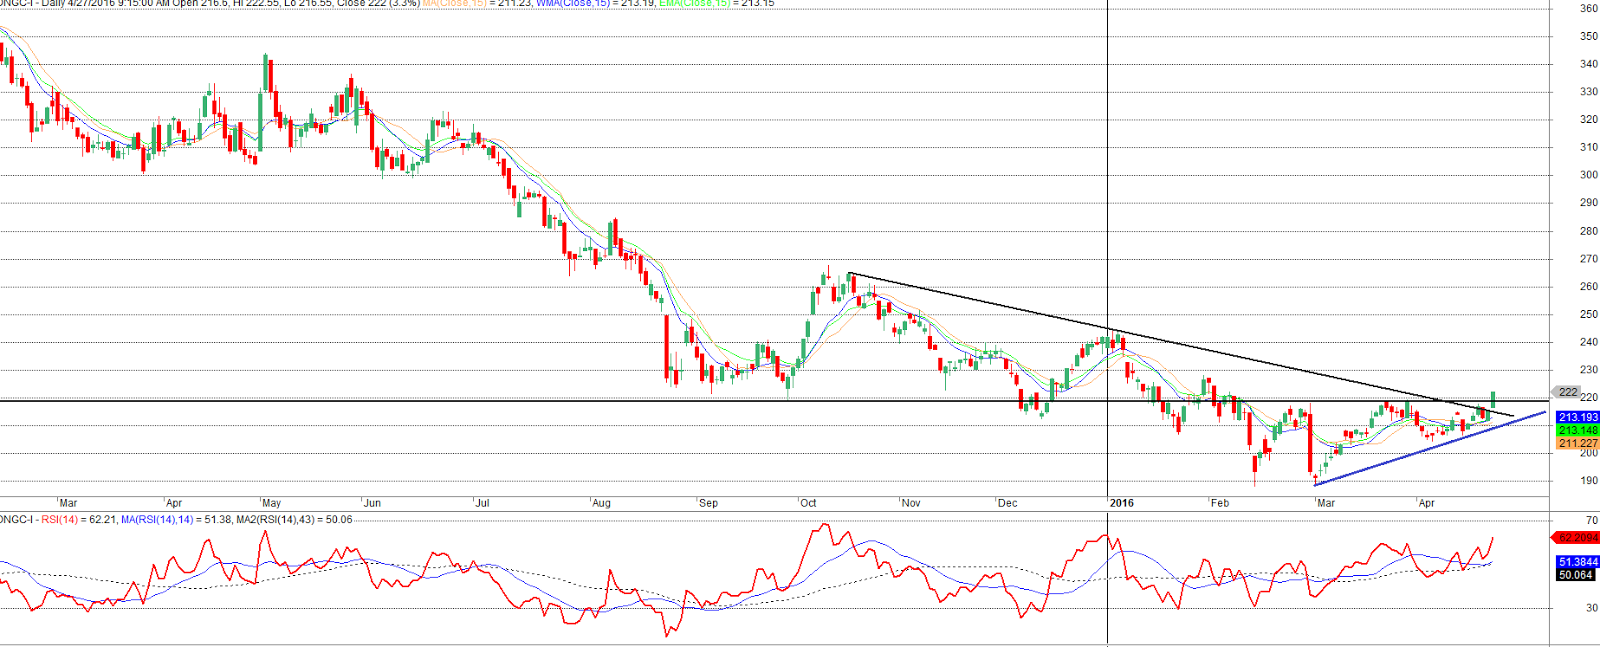
Daily Chart
- ONGC after a long downward trend has broken above slope and key resistance of 220 with good volumes
- The counter has formed an ascending triangle pattern and has broken out
- The stock is trading above short term averages with bullish momentum bias
- Thus counter could be bought with around current levels (219 - 221) with Stop loss of 214 for targets of 235 - 242+
To Know more above next big move in Major Indian Sectors & to Know more detailed Elliot Wave Counts and where probably markets
For Workshops on Technical Analysis & Financial Markets Contact Us
Raju Angadi Vishwanath, MS, CMT
Technical Analyst
rvangadi@googlemail.com
+91 78291 55900


