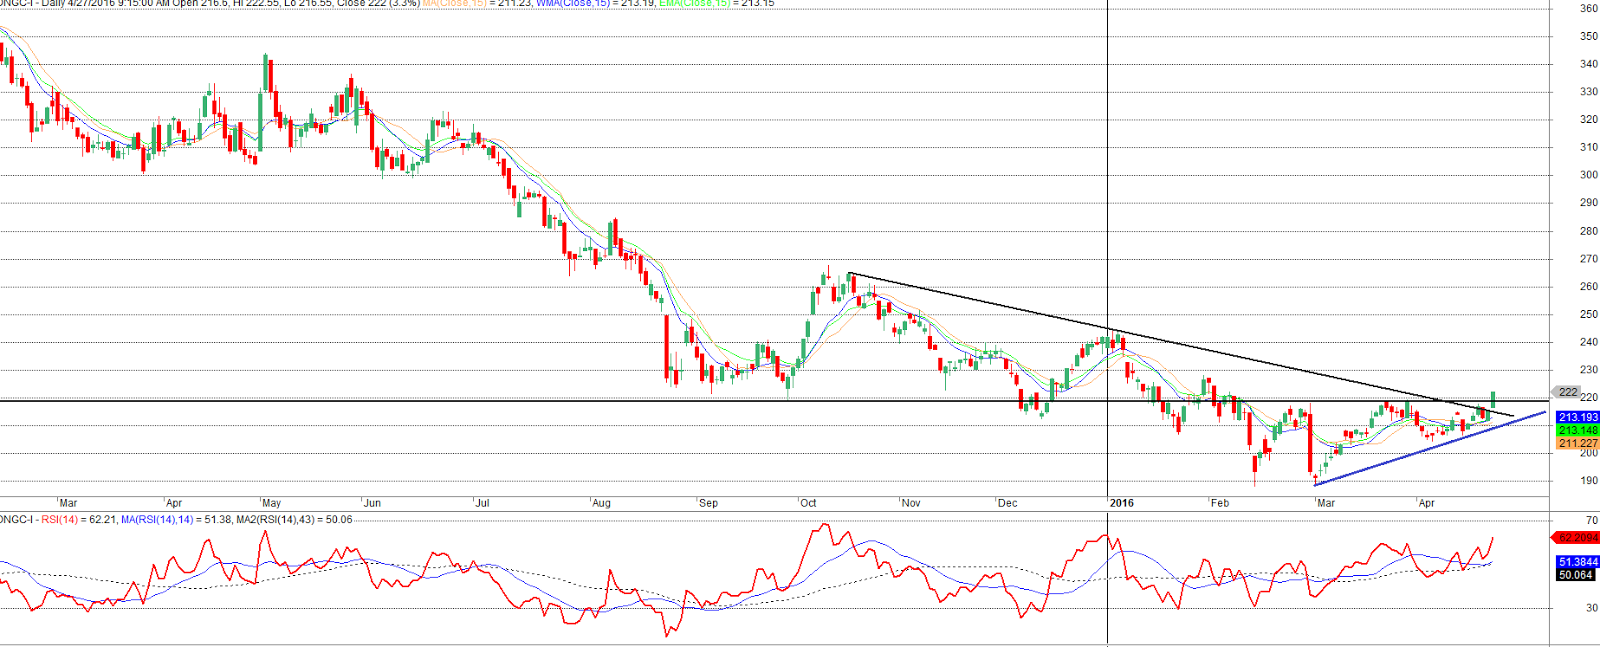
Tuesday 26 April 2016

ONGC - Triangular pattern Breakout


Daily Chart

  • ONGC after a long downward trend has broken above slope and key resistance of 220 with good volumes
  • The counter has formed an ascending triangle pattern and has broken out
  • The stock is trading above short term averages with bullish momentum bias
  • Thus counter could be bought with around current levels (219 - 221) with Stop loss of 214 for targets of 235 - 242+

To Know more above next big move in Major Indian Sectors & to Know more detailed Elliot Wave Counts and where probably markets are heading towards long,  medium and short term levels and which sectors to be in, educate yourself  with us from simple to advanced technical analysis concepts ….

For Workshops on Technical Analysis & Financial Markets Contact Us

Raju Angadi Vishwanath, MS, CMT
Technical Analyst
rvangadi@googlemail.com
+91 78291 55900 

Wednesday 2 March 2016

Bharat Forge in Falling Wedge - What Next ?

                                                 
                                                                        Daily Chart

Bharat forge after a sustained decline has been consolidating near 740 levels which is a strong base
The stock has been forming an ending diagonal / falling wedge pattern
The pattern breakout could yield to swift move towards 865 - 880 and 953 levels

Timing the Entry, Exit and Managing the Risk is Important to capitalize on swing trends .....


To Know more above next big move in Major Indian Sectors & to Know more detailed Elliot Wave Counts and where probably markets are heading towards long,  medium and short term levels and which sectors to be in, educate yourself  with us from simple to advanced technical analysis concepts ....


Why do markets repeat similar patterns in different stocks or Indices ???
Why does Technical Analysis works ????

For Workshops on Technical Analysis & Financial Markets Contact Us


Raju Angadi Vishwanath, B.E., MS, CMT

Technical Analyst
rvangadi@googlemail.com
+91 78291 55900

Tuesday 23 February 2016

The Myth of Same Classical Pattern from Indices to Stocks

The Head and Shoulders is one of the most known and reliable pattern in context to technical analysis which signifies a topping pattern once broken down

This pattern occurs in all time frames and in different forms from simple to complex formations ....

Some of the Key Indices and stocks in Indian Markets do they have still got more pain left .... ???

Lets see the similar Head & Shoulders Patterns in NIFTY, CNX IT, CNX Midcap, CNX Small Cap and few stocks ....

Apart from NIFTY the other indices and stocks are yet to complete the patterns ....


                                                                         NIFTY


                                                                       NIFTY IT
'                                                        


                                                                    NIFTY Midcap


                                                                      NIFTY SmallCap


                                                                       Arvind 


                                                                            ITC

Although the pattern identified in different Indices and stocks are same but the behavior and the action taken needs to be different to benefit from each of them ....


Timing the Entry, Exit and Managing the Risk is Important to capitalize on swing trends .....


To Know more above next big move in Major Indian Sectors & to Know more detailed Elliot Wave Counts and where probably markets are heading towards long,  medium and short term levels and which sectors to be in, educate yourself  with us from simple to advanced technical analysis concepts ....


Why do markets repeat similar patterns in different stocks or Indices ???

Why does Technical Analysis works ????

For Workshops on Technical Analysis & Financial Markets Contact Us


Raju V Angadi Vishwanath, B.E., MS, CMT
Technical Analyst
rvangadi@googlemail.com
+91 78291 55900 

Wednesday 17 February 2016

NIFTY IT Index following Basic Technical Techniques perfectly

                      
                                                           IT Index Daily Chart


  • NIFTY IT Index has broken below the H & S pattern 
  • The Indices is following the classic channeling technique perfectly
  • The application basic tools also would give excellent results some times

The appropriate risk/reward ratio and execution (Entry & Exit) is vital .....

What is NIFTY, Bank NIFTY, NIFTY Pharma, NIFTY FMCG and NIFTY Energy sectors indicating ....
Because it is vital to know market internals to understand the prevailing trend and trend reversal points ....
To Know more above next big move in Major Indian Sectors & to Know more detailed Elliot Wave Counts and where probably markets are heading towards long,  medium and short term levels and which sectors to be in, educate yourself  with us from simple to advanced technical analysis concepts 


For Workshops on Technical Analysis & Financial Markets Contact Us


Raju V Angadi Vishwanath, B.E., MS, CMT
Technical Analyst
rvangadi@googlemail.com
+91 78291 55900


Tuesday 16 February 2016

NIFTY at crucial levels in long term perspective


                                                               NIFTY Weekly Chart

NIFTY 200 Week SMA @ 6875 which breached decisively only in 2008 in last 16 years
The trendline from 2008 lows support on weekly charts around 6800 - 6850
The lower trending channel from top of 9119 to 6869 support at similar levels

The million Dollar Question is where are we heading too ... ????? 
Are we Out of woods ? What the different sectors suggesting ?

What is Bank NIFTY, NIFTY IT, NIFTY Pharma, NIFTY FMCG and NIFTY Energy sectors indicating ....


Because it is vital to know market internals to understand the prevailing trend and trend reversal points ....
To Know more above next big move in Major Indian Sectors & to Know more detailed Elliot Wave Counts and where probably markets are heading towards long,  medium and short term levels and which sectors to be in, educate yourself  with us from simple to advanced technical analysis concepts 


For Workshops on Technical Analysis & Financial Markets Contact Us


Raju V Angadi Vishwanath, B.E., MS, CMT
Technical Analyst
rvangadi@googlemail.com
+91 78291 55900