The Bankex roars 6% today on the statement of RBI measures to ease liquidity from yesterday low of 8855 to 9799 odd levels. There was a technical short covering due at the support zone and the news sync in. The index has provided stellar of a returns of around 8 - 10% in two trading sessions It is advisable to book part profits for the long position holders and revise stop loss to 9500 for targets of 10000.
Disclaimer: This is just an view based on the research of individual for educational purpose. So kindly trade along with the consultation of your financial adviser, market trends, price action and own risk appetite considered while investing or trading in stock markets.
The Bank NIFTY has fallen from highs of 13414 to 9100 odd levels almost 33% wiped out in one the Asia's widely traded indices. The bears have butchered the index. The USDINR hitting all time low of 63.18 and an Reserve bank of India's measures to control dollar demand has also failed, which is not a good sign for interest rate sensitives such as mainly INFRA, REALITY and BANKEX. Fundamentally slower GDP growth around 5% odd levels, high dollar, more imports and higher crude oil prices are impacting the Indian economy.
Trade objectively and wisely with the consideration of own risk with amid volatility. The strategy would be to wait patiently for the right opportunity to unfold to probable profitable trade setups.
Raju V Angadi
Equity Research Analyst
To know more about probable counts contact us back on rvangadi@googlemail.com
Disclaimer: This is just an view based on the research of individual for educational purpose. So kindly trade along with the consultation of your financial adviser, market trends, price action and own risk appetite considered while investing or trading in stock markets.
The Bank NIFTY has fallen from highs of 13414 to 9100 odd levels almost 33% wiped out in one the Asia's widely traded indices. The bears have butchered the index. The USDINR hitting all time low of 63.18 and an Reserve bank of India's measures to control dollar demand has also failed, which is not a good sign for interest rate sensitives such as mainly INFRA, REALITY and BANKEX. Fundamentally slower GDP growth around 5% odd levels, high dollar, more imports and higher crude oil prices are impacting the Indian economy.

BANK NIFTY Daily Chart
Technically Bank NIFTY has breached the long term trend line around 10200 - 10220 odd levels of a move from 3400 - 13400 odd levels. Overall in medium to long term looks much more downside is ahead for the BANKEX. A medium to long term outlook for the index is bearish below 8000 odd levels.

BANK NIFTY Daily Chart
The key levels to watch out for the index is 8950 - 9100, as 9098 is also a 76.4% fibonacci retracement of a move from 7766 - 13414, which can act as a short term support and a short covering index can be seen up to 9500/ 10000 odd levels . One can build contrary trades on the indices with stop loss below 8800 for targets of 9500 and 10000. Technically a short covering bounce of 6 - 8% can be seen in the index If the support are held as the indices is in the oversold arena.
The heavy weights in the indices are ICICI Bank, HDFC, HDFC Bank, AXIS Bank and SBI.
HDFC Limited
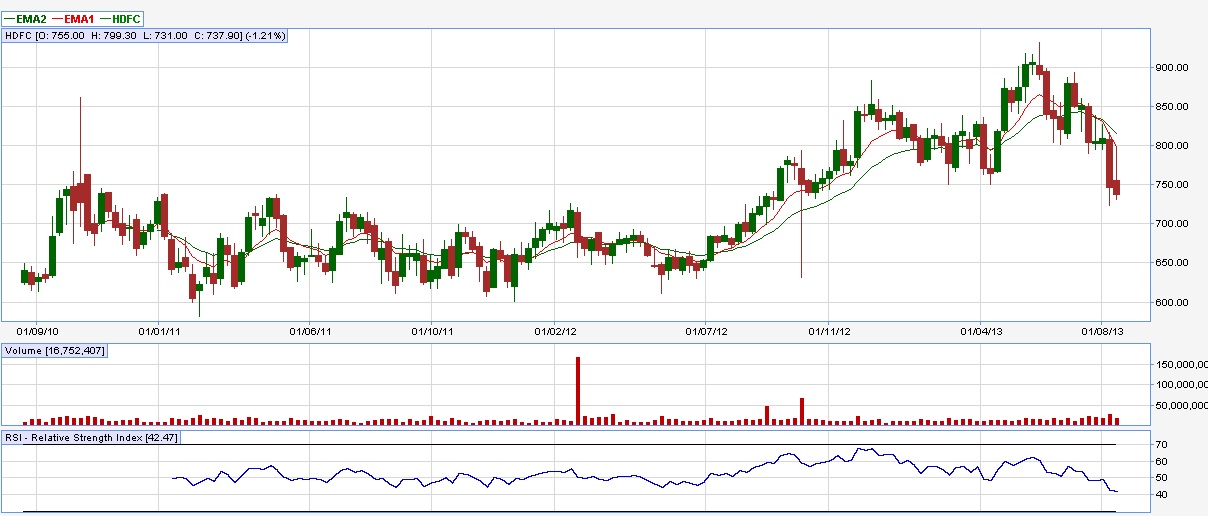
HDFC Daily Chart

HDFC Daily Chart
HDFC has fallen from 930 - 710 odd levels the key support for the counter is around 684 / 710. The 76.4% retracement also for the entity of a move from 640 - 930 odd levels is around 680.
On weekly charts also HDFC is showing a fair support around 690 - 700 odd levels.
It is advisable that one can accumulate the counter around 685 - 710 for targets of 750.
ICICI BANK

ICICI BANK Weekly Chart
ICICI Bank has been battered from 1230 - 815 odd levels which is almost 33% fall from highs nearing its support area. One can consider buying the counter around 785 - 800 for targets of 875 with a stop loss below 770 as risk reward is favorable.
AXIS Bank

Axis Bank Daily Chart
Axis Bank has from 1530 - 990 odd levels, which is having a strong support around range of 950 - 965. The entity can bounce back towards 1100 odd levels which is 61.8% retracement of a move from 784 - 1550. So one can accumulate the counter around 950 - 960 for a short term bounce with stop loss below 930.
Yes Bank

Yes Bank Daily chart
Yes Bank has fallen more than 50% from 500 - 240 odd levels. One can accumulate the stock around 225 - 230 odd levels with a stop of 210 for targets of 250/280. The 61.8% retracement of the move from 40 to 550. The stock can hold the support of 225 - 230 and a short covering of 10 - 15% in the entity can be seen. Above 250 levels of 285+ can be witnessed in the counter.
Trade objectively and wisely with the consideration of own risk with amid volatility. The strategy would be to wait patiently for the right opportunity to unfold to probable profitable trade setups.
Raju V Angadi
Equity Research Analyst
To know more about probable counts contact us back on rvangadi@googlemail.com
Disclaimer: This is just an view based on the research of individual for educational purpose. So kindly trade along with the consultation of your financial adviser, market trends, price action and own risk appetite considered while investing or trading in stock markets.

