Tuesday, 26 April 2016

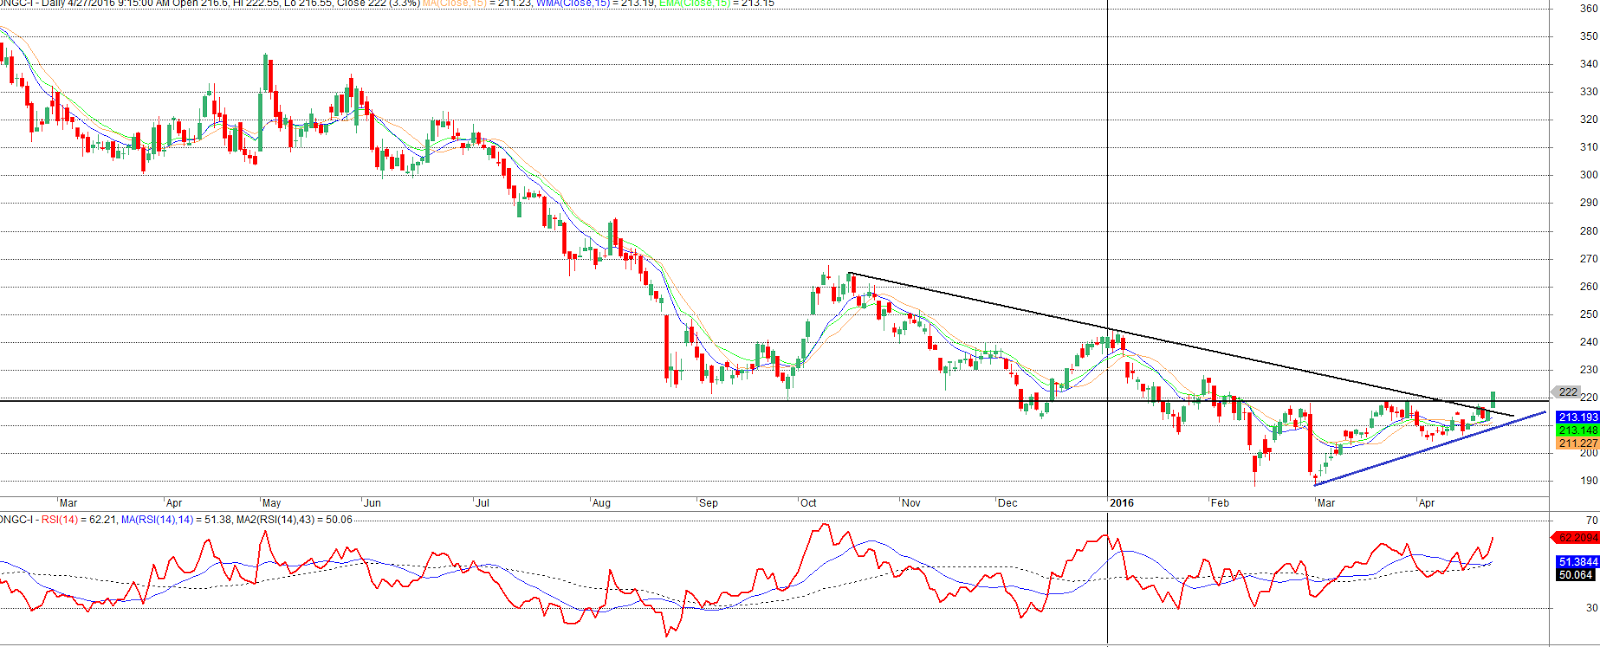
ONGC - Triangular pattern Breakout


Daily Chart

  • ONGC after a long downward trend has broken above slope and key resistance of 220 with good volumes
  • The counter has formed an ascending triangle pattern and has broken out
  • The stock is trading above short term averages with bullish momentum bias
  • Thus counter could be bought with around current levels (219 - 221) with Stop loss of 214 for targets of 235 - 242+

To Know more above next big move in Major Indian Sectors & to Know more detailed Elliot Wave Counts and where probably markets are heading towards long,  medium and short term levels and which sectors to be in, educate yourself  with us from simple to advanced technical analysis concepts ….

For Workshops on Technical Analysis & Financial Markets Contact Us

Raju Angadi Vishwanath, MS, CMT
Technical Analyst
rvangadi@googlemail.com
+91 78291 55900 

Wednesday, 2 March 2016

Bharat Forge in Falling Wedge - What Next ?

                                                 
                                                                        Daily Chart

Bharat forge after a sustained decline has been consolidating near 740 levels which is a strong base
The stock has been forming an ending diagonal / falling wedge pattern
The pattern breakout could yield to swift move towards 865 - 880 and 953 levels

Timing the Entry, Exit and Managing the Risk is Important to capitalize on swing trends .....


To Know more above next big move in Major Indian Sectors & to Know more detailed Elliot Wave Counts and where probably markets are heading towards long,  medium and short term levels and which sectors to be in, educate yourself  with us from simple to advanced technical analysis concepts ....


Why do markets repeat similar patterns in different stocks or Indices ???
Why does Technical Analysis works ????

For Workshops on Technical Analysis & Financial Markets Contact Us


Raju Angadi Vishwanath, B.E., MS, CMT

Technical Analyst
rvangadi@googlemail.com
+91 78291 55900

Tuesday, 23 February 2016

The Myth of Same Classical Pattern from Indices to Stocks

The Head and Shoulders is one of the most known and reliable pattern in context to technical analysis which signifies a topping pattern once broken down

This pattern occurs in all time frames and in different forms from simple to complex formations ....

Some of the Key Indices and stocks in Indian Markets do they have still got more pain left .... ???

Lets see the similar Head & Shoulders Patterns in NIFTY, CNX IT, CNX Midcap, CNX Small Cap and few stocks ....

Apart from NIFTY the other indices and stocks are yet to complete the patterns ....


                                                                         NIFTY


                                                                       NIFTY IT
'                                                        


                                                                    NIFTY Midcap


                                                                      NIFTY SmallCap


                                                                       Arvind 


                                                                            ITC

Although the pattern identified in different Indices and stocks are same but the behavior and the action taken needs to be different to benefit from each of them ....


Timing the Entry, Exit and Managing the Risk is Important to capitalize on swing trends .....


To Know more above next big move in Major Indian Sectors & to Know more detailed Elliot Wave Counts and where probably markets are heading towards long,  medium and short term levels and which sectors to be in, educate yourself  with us from simple to advanced technical analysis concepts ....


Why do markets repeat similar patterns in different stocks or Indices ???

Why does Technical Analysis works ????

For Workshops on Technical Analysis & Financial Markets Contact Us


Raju V Angadi Vishwanath, B.E., MS, CMT
Technical Analyst
rvangadi@googlemail.com
+91 78291 55900 

Wednesday, 17 February 2016

NIFTY IT Index following Basic Technical Techniques perfectly

                      
                                                           IT Index Daily Chart


  • NIFTY IT Index has broken below the H & S pattern 
  • The Indices is following the classic channeling technique perfectly
  • The application basic tools also would give excellent results some times

The appropriate risk/reward ratio and execution (Entry & Exit) is vital .....

What is NIFTY, Bank NIFTY, NIFTY Pharma, NIFTY FMCG and NIFTY Energy sectors indicating ....
Because it is vital to know market internals to understand the prevailing trend and trend reversal points ....
To Know more above next big move in Major Indian Sectors & to Know more detailed Elliot Wave Counts and where probably markets are heading towards long,  medium and short term levels and which sectors to be in, educate yourself  with us from simple to advanced technical analysis concepts 


For Workshops on Technical Analysis & Financial Markets Contact Us


Raju V Angadi Vishwanath, B.E., MS, CMT
Technical Analyst
rvangadi@googlemail.com
+91 78291 55900


Tuesday, 16 February 2016

NIFTY at crucial levels in long term perspective


                                                               NIFTY Weekly Chart

NIFTY 200 Week SMA @ 6875 which breached decisively only in 2008 in last 16 years
The trendline from 2008 lows support on weekly charts around 6800 - 6850
The lower trending channel from top of 9119 to 6869 support at similar levels

The million Dollar Question is where are we heading too ... ????? 
Are we Out of woods ? What the different sectors suggesting ?

What is Bank NIFTY, NIFTY IT, NIFTY Pharma, NIFTY FMCG and NIFTY Energy sectors indicating ....


Because it is vital to know market internals to understand the prevailing trend and trend reversal points ....
To Know more above next big move in Major Indian Sectors & to Know more detailed Elliot Wave Counts and where probably markets are heading towards long,  medium and short term levels and which sectors to be in, educate yourself  with us from simple to advanced technical analysis concepts 


For Workshops on Technical Analysis & Financial Markets Contact Us


Raju V Angadi Vishwanath, B.E., MS, CMT
Technical Analyst
rvangadi@googlemail.com
+91 78291 55900


Tuesday, 19 January 2016

Pharma Index - Will the out performance to continue in medium term ?


                                                                    Weekly Chart


After stellar outperformance for 5 odd years pharma sector has been subdued from past 10 months
The Index forming a flat 3-3-5 corrective pattern on the verge of completion

Can the Index regain charm in the medium term coming months ahead to attain fresh highs in the form of wave 5 up ?

Stocks to watch out:

Lupin & Cipla

To Know more above next big move in Major Indian Sectors & to Know more detailed Elliot Wave Counts and where probably markets are heading towards long,  medium and short term levels and which sectors to be in, educate yourself  with us from simple to advanced technical analysis concepts For Workshops on Technical Analysis & Financial Markets Contact Us


Raju V Angadi Vishwanath, B.E., MS, CMT
Technical Analyst
rvangadi@googlemail.com
+91 78291 55900

Sunday, 17 January 2016

PSU Bank Index - Medium term Outlook, Could fortunes revive in 2016 ?


                                                     PSU Bank Index Weekly Chart


Bang !!! Bang !!! PSU Banks butchered literally ....
Is this the time to be Buying PSU Banks selectively or still more pain left is the question ?

Sentimentally it has been fed to public that PSU Banks will vanish and will not exist in future?

Technically .... What are charts suggesting in PSU Bank Index ???

Today index on daily chart is forming an hammer pattern .... The closer of pattern indicates the halt of down trend ....

The Wave counts hold true we might have a stellar short covering even on worst case scenario and the best case scenario would be  start of mother of Bull run of Wave III ....

Keep fingers crossed wait for confirmation and be in selective stocks is the key .....

To Know more above next big move in Major Indian Sectors & to Know more detailed Elliot Wave Counts and where probably markets are heading towards long,  medium and short term levels and which sectors to be in, educate yourself  with us from simple to advanced technical analysis concepts For Workshops on Technical Analysis & Financial Markets Contact Us


Raju V Angadi Vishwanath, B.E., MS, CMT
Technical Analyst
rvangadi@googlemail.com
+91 78291 55900


Is India Story over so early ? Midcap Index Outlook ?


                                                        Midcap Index Weekly Chart


People have extreme sentimental bias when in panic crowd think its end and history has proved selling climaxes happen
Is the Indian growth and midcap story over ???
What about the crude advantage and India's demographics?
A Head & Shoulder in Midcap Index is forming .... Still a neckline not broken

Corrections are part of rallies and is shown that bull market corrections are swift ....

What does wave counts suggesting ???

We are in larger degree Wave III of Wave 3 of (3) of 1 of (iv) ....

In short we could be in wave 4 correction .... What next ?

To Know more above next big move in Major Indian Sectors & to Know more detailed Elliot Wave Counts and where probably markets are heading towards long,  medium and short term levels and which sectors to be in, educate yourself  with us from simple to advanced technical analysis concepts For Workshops on Technical Analysis & Financial Markets Contact Us


Raju V Angadi Vishwanath, B.E., MS, CMT
Technical Analyst
rvangadi@googlemail.com
+91 78291 55900

Tuesday, 12 January 2016

NIFTY - Are we seeing a Selling Climax?


                                                                   Daily Chart


Weekly Chart 

Interesting times scary environment are we heading much lower in Indian Equities or are we nearing bottom ???

Our previous update on NIFTY as per wave counts was 7th December on NIFTY
As we are in a correction of complex nature of W-X-Y-X-Z
It could well be a selling climax today
This week we could see more final pain in place


The question is we would make fresh highs this year or are we heading lower ??? Or would we cross 8500 atleast ???

The answer to the question is Wave counts suggesting Indian Equities we may hit fresh highs this year .... 

The key supports would be 7422 / 7386/7225

To Know more above next big move in Major Indian Sectors & to Know more detailed Elliot Wave Counts and where probably markets are heading towards long,  medium and short term levels and which sectors to be in, educate yourself  with us from simple to advanced technical analysis concepts For Workshops on Technical Analysis & Financial Markets Contact Us


Raju V Angadi Vishwanath, B.E., MS, CMT
Technical Analyst
rvangadi@googlemail.com
+91 78291 55900

Thursday, 7 January 2016

Aurbindo Pharma - Rising Wedge Pattern (Bang on !!! Banged) Update ....


Aurbindo Pharma Bang on Banged !!! 


                                                               Weekly Chart


After completion of Ending Diagonal pattern stock falls swiftly losing 25+% in mere 1.5 months from 825 odd levels now below 600 levels ...

 This is one of the classical examples of serious implications of a spontaneous moves after the completion of ending diagonal ... 

Crude Oil is forming one of such pattern recently .... So What is in store for Crude Oil next .....


But timing is vital to short trades particularly ...

To Know more above next big move in Equity, Commodity & Currency Markets where the next swing move lies & to Know more detailed Elliot Wave Counts and where probably markets are heading towards long,  medium and short term levels and which sectors to be in, educate yourself  with us from simple to advanced technical analysis concepts 

  For Workshops on Technical Analysis & Financial Markets Contact Us 


Raju Angadi Vishwanath, B.E., MS, CMT
Technical Analyst
rvangadi@googlemail.com
+91 78291 55900


                                                                  Daily Chart


Auro Pharma has been a stellar out performer from past 2 years
The stock has given its investors dream Bull run from 80 odd levels to 900 odd levels

As there is a Quote "For Every thing there is an end in the this world"

The Question is  are we nearing the End ??


Trading Patterns is suggesting we may be nearing the end or else at least a correction in the stock may trigger
The counter is in the process of forming a ending diagonal and Evening star pattern on charts
Yet to confirm below 13-WMA and lower supports 818 - 790 could trigger a swift sell off ...

But timing is vital to short particularly ...

"The Whole purpose of Education is to turn mirrors into Windows" ....


- Sydney J. Haris

To Know more above next big move in Equity, Commodity & Currency Markets where the next swing move lies & to Know more detailed Elliot Wave Counts and where probably markets are heading towards long,  medium and short term levels and which sectors to be in, educate yourself  with us from simple to advanced technical analysis concepts 

  For Workshops on Technical Analysis & Financial Markets Contact Us 


Raju Angadi Vishwanath, B.E., MS, CMT
Technical Analyst
rvangadi@googlemail.com
+91 78291 55900

Tuesday, 22 December 2015

Bullish Pattern Seen in two Telcom Stocks

  • Bharti Airtel and RCOM has broken out of inverse H & S pattern
  • Both stocks are strong under performers from past 6 months
  • Now looking attractive at current levels to dips
  • Stocks trading above short term averages indicating inherent strength


                                                             Bharti Airtel - Daily Chart


                                                                    RCOM - Daily Chart


To Know more above next big move in Major Indian Sectors & to Know more detailed Elliot Wave Counts and where probably markets are heading towards long,  medium and short term levels and which sectors to be in, educate yourself  with us from simple to advanced technical analysis concepts 


 For Workshops on Technical Analysis & Financial Markets Contact Us 


Raju Angadi Vishwanath, B.E., MS, CMT
Technical Analyst
rvangadi@googlemail.com
+91 78291 55900


Friday, 11 December 2015

US Federal Reserve Meet Mania ..... Dow Jones - What is in Store Chartistically ? (Update from Dec 1th 2015)

Dow Jones once broke 16900 entered a free fall zone tests our 2nd tgt 15370 yesterdays low and recoups losses.

Whats next for Dow Jones key trend decider for global markets ?

The key is to not just applying Elliot waves along with that basic and advanced indicators to time the entry to is vital to simplify trades ....

To Know more above next big move in Major Indian Sectors & to Know more detailed Elliot Wave Counts and where probably markets are heading towards long,  medium and short term levels and which sectors to be in, educate yourself  with us from simple to advanced technical analysis concepts 

   For Workshops on Technical Analysis & Financial Markets Contact Us 


Raju Angadi Vishwanath, B.E., MS, CMT
Technical Analyst
rvangadi@googlemail.com
+91 78291 55900


Weekly Chart
  • Dow Jones has been persistent out performer in 2015 holding up its gain
  • US Markets grand daddy of all financial markets showing sings of fatigue from last couple of trading sessions 
  • Charts suggesting a double top kind of a pattern formation
  • Counts suggesting probable flat correction the major index can enter into
  • Global Equity markets look vulnerable

17050 - 16900 in Dow Jones becomes vital


To Know more above next big move in Major Indian Sectors & to Know more detailed Elliot Wave Counts and where probably markets are heading towards long,  medium and short term levels and which sectors to be in, educate yourself  with us from simple to advanced technical analysis concepts 


 For Workshops on Technical Analysis & Financial Markets Contact Us 


Raju Angadi Vishwanath, B.E., MS, CMT
Technical Analyst
rvangadi@googlemail.com
+91 78291 55900


Monday, 7 December 2015

NIFTY - Are we entering matured stages of correction - Wave Counts ?


  • The Indian Major Indices in a Complex Wave (4) correction in the form of W-X-Y-X-Z
  • NIFTY has been correcting from last 8 months (April 2015) a first lower top formed
  • Are we in the mature final stages of correction?
  • Lowest Volume today in NIFTY in 2015
  • Fading volumes near lower levels indicating lack of momentum towards prevailing trend


Timing becomes crucial for trading or investing

"Knowledge will bring you the opportunity to make a difference"

 - Elaire Fragin


To Know more above next big move in Major Indian Sectors & to Know more detailed Elliot Wave Counts and where probably markets are heading towards long,  medium and short term levels and which sectors to be in, educate yourself  with us from simple to advanced technical analysis concepts For Workshops on Technical Analysis & Financial Markets Contact Us


Raju V Angadi Vishwanath, B.E., MS, CMT
Technical Analyst
rvangadi@googlemail.com
+91 78291 55900

Sunday, 6 December 2015

Reliance Industries - Long term Pattern forming


Reliance Industries have been a distinct under performer in past 7 years

A Million Dollar Question is - One of the NIFTY heavy weights under performance to continue or Are we near change in trend for "Long Term"?

The counter is forming an Ascending Triangle pattern ....

Timing Entry and Exits is vital in trading or investing ....


"The Direction in which education starts A Man will determine his future in life"

- PLATO


To Know more above next big move in Major Indian Sectors & to Know more detailed Elliot Wave Counts and where probably markets are heading towards long,  medium and short term levels and which sectors to be in, educate yourself  with us from simple to advanced technical analysis concepts For Workshops on Technical Analysis & Financial Markets Contact Us


Raju V Angadi Vishwanath, B.E., MS, CMT
Technical Analyst
rvangadi@googlemail.com
+91 78291 55900

CNX Media - What is in store?


                                                             CNX Media Daily Chart

 After persistent higher top and higher bottom formation from August 2013 CNX Media is forming a lower top
  • The chart pattern suggesting Irregular Flat correction seems to be under way in the form of Wave C 
  • Indicators showing bearish swift

Stocks to Watch Out:

Zee Entertainment

"Education is the manifestation of perfection already in Man"


To Know more above next big move in Major Indian Sectors & to Know more detailed Elliot Wave Counts and where probably markets are heading towards long,  medium and short term levels and which sectors to be in, educate yourself  with us from simple to advanced technical analysis concepts For Workshops on Technical Analysis & Financial Markets Contact Us


Raju V Angadi Vishwanath, B.E., MS, CMT
Technical Analyst
rvangadi@googlemail.com
+91 78291 55900

Tuesday, 1 December 2015

Engineering Stocks Buzzing in trade from few weeks


                                                                  CEBBCO Weekly Chart


                                                                  Shanti Gear Weekly Chart

Many Engineering stocks buzzing in trade from couple of weeks
Its a Small Cap & Midcap Mania
CEBCCO forming rounding bottom pattern with today close on higher volumes indicating more to come CMP (26.30)
Shanti Grear forming Inverse H & S pattern (CMP = 110)

To Know more above next big move in Major Indian Sectors & to Know more detailed Elliot Wave Counts and where probably markets are heading towards long,  medium and short term levels and which sectors to be in, educate yourself  with us from simple to advanced technical analysis concepts For Workshops on Technical Analysis & Financial Markets Contact Us


Raju V Angadi Vishwanath, B.E., MS, CMT
Technical Analyst
rvangadi@googlemail.com
+91 78291 55900

Tuesday, 10 November 2015

Doomed !!! CNX IT - In Coil Pattern what next ? (Updated)

CNX IT cracks from 11600 to 11060 odd levels ....

Index heavy weights TCS & Infosys are major culprits in fall contributing to depriciation of Indices ..

To Know more above next big move in Major Indian Sectors & to Know more detailed Elliot Wave Counts and where probably markets are heading towards long,  medium and short term levels and which sectors to be in, educate yourself  with us from simple to advanced technical analysis concepts For Workshops on Technical Analysis & Financial Markets Contact Us


Raju V Angadi Vishwanath, B.E., MS, CMT
Technical Analyst
rvangadi@googlemail.com
+91 78291 55900


                                                                             Daily Chart


- CNX IT in a symmetrical triangle
- Which way can it breakout ?

S - 11200/10750
R - 11590/11800/12000

To Know more detailed Elliot Wave Counts and where probably markets are heading towards long,  intermediate and short term levels and which sectors to be in, educate yourself  with us from simple to advanced concepts contact us.


Raju V Angadi Vishwanath, B.E., MS, CMT
Equity Technical Analyst

"Education is the movement from darkness to light ...." 

- Allan Boom

To Learn simplified objective approach applying Advanced concepts of Objective Elliot Wave Theory in conjunction with Advanced Dow Theory & Psychological traits to trade with some common sense & optimize your investment / trading decisions attend our next workshop ...


 rvangadi@googlemail.com (or) +91 78291 55900

Thursday, 5 November 2015

NIFTY roadmap ahead - Bhiar Election results or Objectivity?


                                                            Weekly Chart

- NIFTY after making a high 9119 have been on corrective from February 2015
- Its been 8 months we are into consolidation phase
- Seems to be we are in Wave 4 correction of a 5-wave advance
- Can Bihar elections be the trigger to pull the index up or still some time left?
- Before a meaning full correction still NIFTY is having a potential to test 10000+ levels

But timing is crucial .... Its vital to trade objectively .... Identification of key reversal points with risk management techniques will assist in attaining consistency .....

Corrective moves are frustrating and hard to trade by where people lose money ....

Scenario:

Case 1:
NIFTY hold support 7970 can start rally back towards 8400+ levels

Case 2:
NIFTY breaks 7970 panic selling may emerge and 7690 can be visited .. worst case can test 7450 levels

Key Support      :   7970 - 7820 - 7690 - 7446
Key Resistance :   8140 - 8200 - 8250 > 8340 - 8400 - 8630


To Know more detailed Elliot Wave Counts and where probably markets are heading towards long,  intermediate and short term levels and which sectors to be in, educate yourself  with us from simple to advanced concepts contact us.


Raju V Angadi Vishwanath, B.E., MS, CMT
Equity Technical Analyst

"An investment in knowledge pays best interest ...." 

- Benjamin Franklin


To Learn simplified objective approach applying Advanced concepts of Objective Elliot Wave Theory in conjunction with Advanced Dow Theory & Psychological traits to trade with some common sense & optimize your investment / trading decisions attend our next workshop ...

For Workshops on Technical Analysis & Financial Markets Contact on:

 rvangadi@googlemail.com (or) +91 78291 55900